Listening Together
Every second, 30,000 users from all around the world hit play on a Spotify song at the same time. We worked with Spotify to create a data…
Every second, 30,000 users from all around the world hit play on a Spotify song at the same time. We worked with Spotify to create a data visualization that tells this story. From South Africa to Australia, Mexico to Singapore, this is Listening Together.
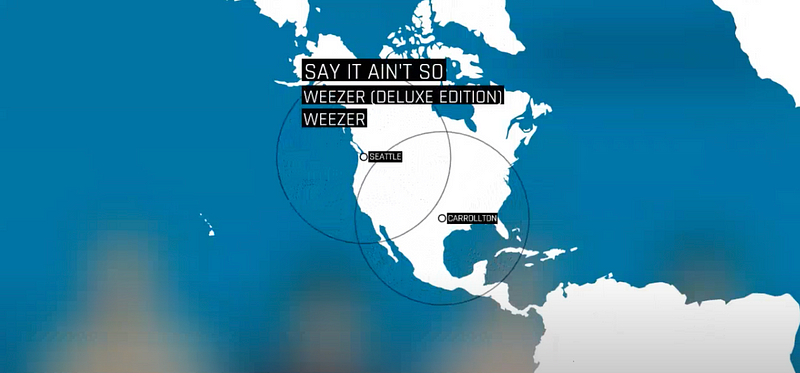
Conceptually stemming from Serendipity, a 2014 Spotify piece by Media Artist Kyle McDonald, Listening Together visually connects users who press play on the same song, at the same time. Drawing data from a real-time API, we tried to make the experience visually captivating and interactive, encouraging users to engage with the data and explore the world.
An Evolving, Interactive World
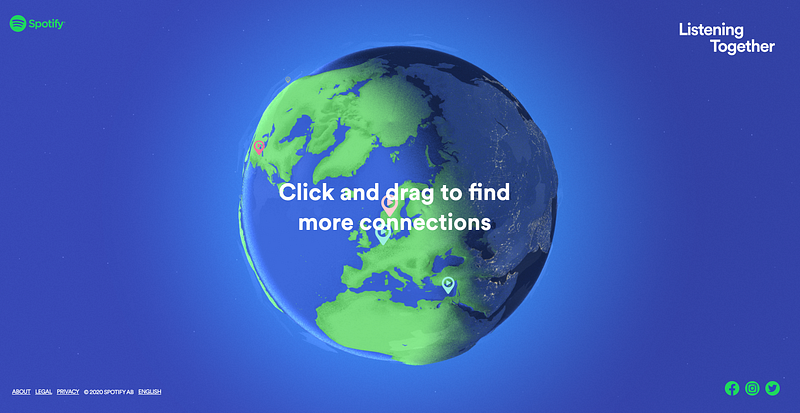
From a user perspective, the initial iterations of the idea were similar to a desktop screensaver, as the build would scroll through each data pairing one-by-one. Given the data was from a real-time API, we wanted the experience to feel dynamic and real. By allowing the user to control the camera and look around the globe, the Listening Together world feels more like an evolving environment, and less like a video on a track.
The Globe
Given the globe was the center-piece of the experience, and effectively the only visual to play with — we invested some time in our treatment of it.
Early Visuals and Experimentation
Early experimentations began with 3D renders in Cinema4D. This allowed us to find a compelling creative direction that could be recreated in WebGL for the actual experience.
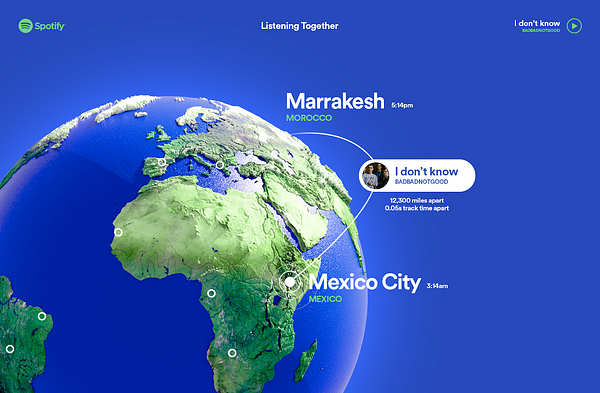
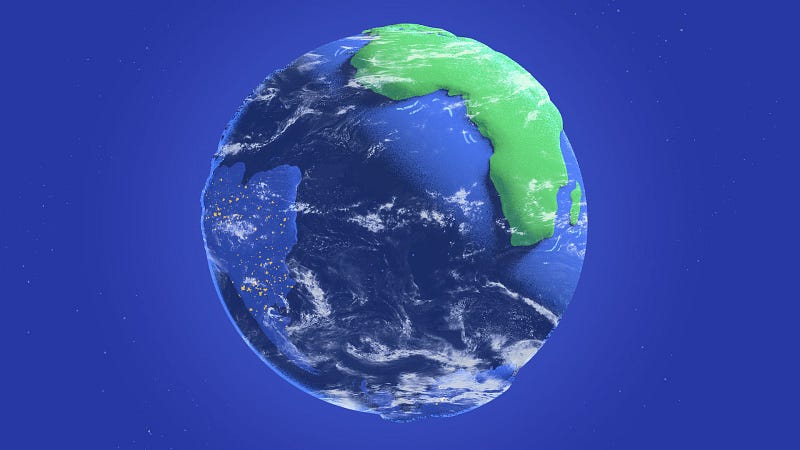
Early experimentations in Cinema4D helped us refine the visual style.
Day and Night
Given our intention was to create a dynamic and realistic-feeling world, we created the globe with a ‘day and night’ feel that loosely maps to the timezone that the user is viewing the experience from.
From an executional standpoint, ‘noisy light’ was a key component to pull this off visually. To do this, we used a directional light to extract different ‘gradients’ produced by the light (essentially areas that are neither fully dark nor fully bright). Once we had these areas extracted, we mapped a noise texture in the direction of the gradient, using the gradient as both a blend value and noise distribution (the darker, the more spread out).
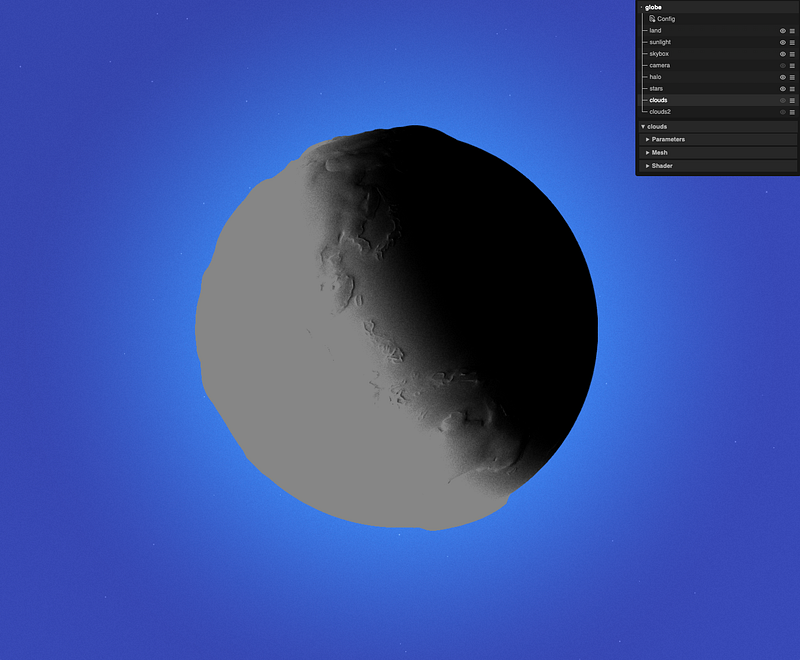
Using a similar technique, we also created a rim light mapped to gradient noise:
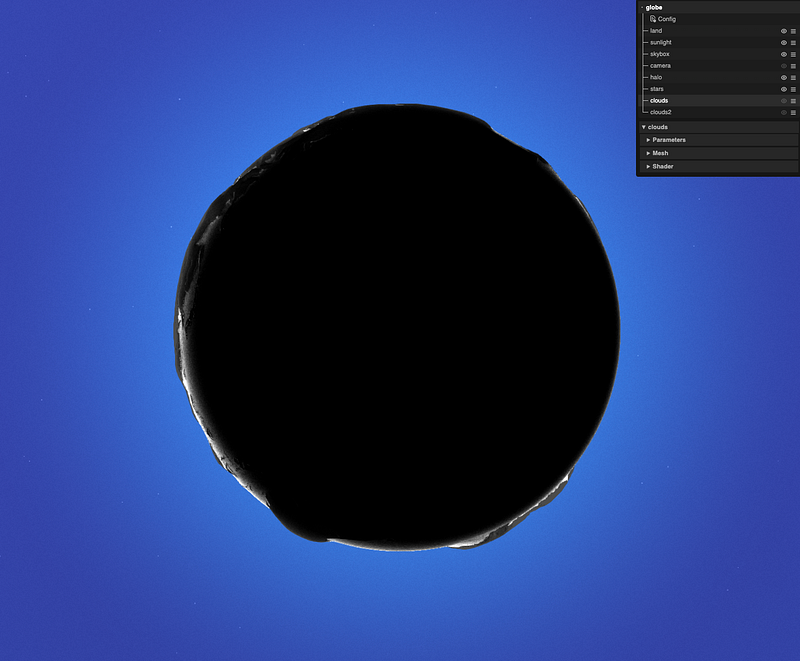
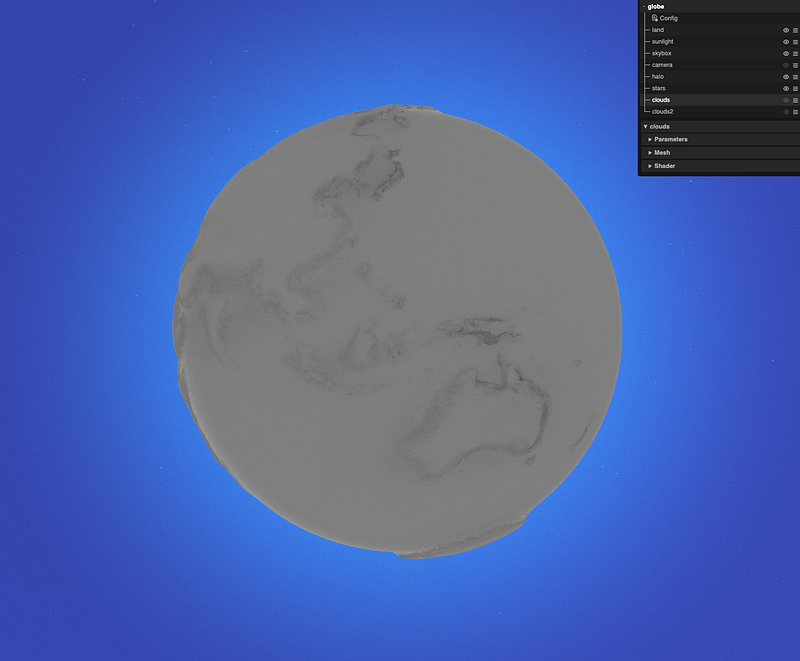
Bringing in the sun light (based on current time), the result was a black and white texture that could be directly mapped to day and night colors in the experience. A normal map was also used to add elevation details.

Shorelines and Oceans
A hand-painted occlusion map helped bring some contrast around the shorelines. This also accentuated the dotwork style we were going for.
The waves were rendered with a simple trick. Each wave was drawn using a gradient stroke that would indicate the direction of the wave (red). We then used different shades of green in the gradient as a time offset in the shader. This ensured waves would play at different times, giving the oceans a natural feel.
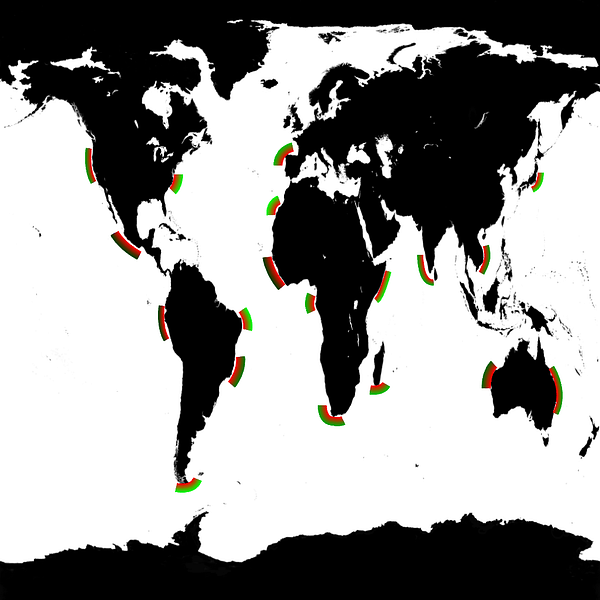
Gradient strokes to direct the waves and offset their timing.
Bringing it Together
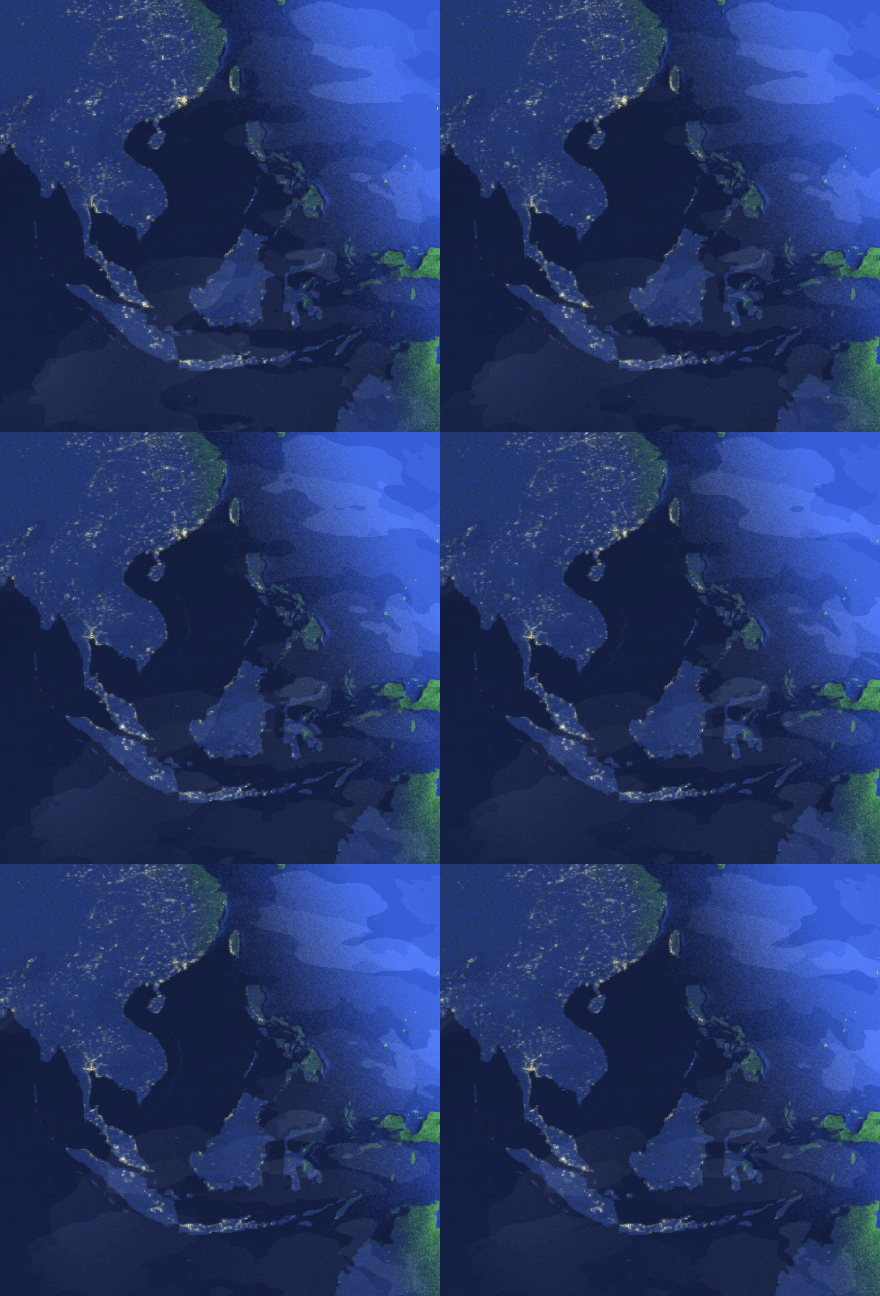
Combining the above layers and techniques along with the addition of nightlights, clouds and waves — we had our final render.
Using our internal pipeline, this was exported with many different settings to allow designers to tweak values and swap textures for final visual polish.
Using Real-Time Data
Central to this story was using actual data that would evolve over time as users listening habits change globally. Working with Spotify, we pulled data from an API that returns near real-time data about songs being played at the same time.
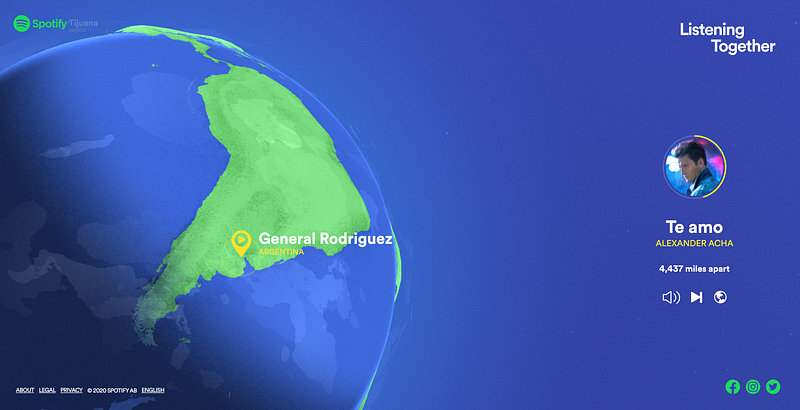
While there’s about 30,000 songs a second to choose from, we wanted to highlight data points that would tell a visual story (as selecting two points from the same city wouldn’t look very compelling).
Given the API gave latitude and longitude data, we were able to avoid visual overlap and make camera adjustments as the data story plays out. For instance, the lower the latitude, the steeper the camera angle.
Launch and Reception
Going live on on May 6 2020, the experience was quickly picked up by news outlets like Billboard, FastCompany and AdWeek. The experience also picked up traction on social media, with some users even searching for their own matches as they listened to songs (maybe a project for the future).
Spotify Listening Together is available to access here.
